


BREAKING: Silver Miners Lose Half A Billion Dollars
BREAKING: Silver Miners Lose Half A Billion Dollars
In an amazing change of events, the top primary silver miners went from making money in the first quarter of 2013, to losing over half a billion dollars in second quarter. The majority of losses came from huge impairment charges due to much lower silver spot prices during the period.
If we look at the chart below we can see how three months and substantially lower silver prices can impact the bottom line in the top 12 primary silver miners:
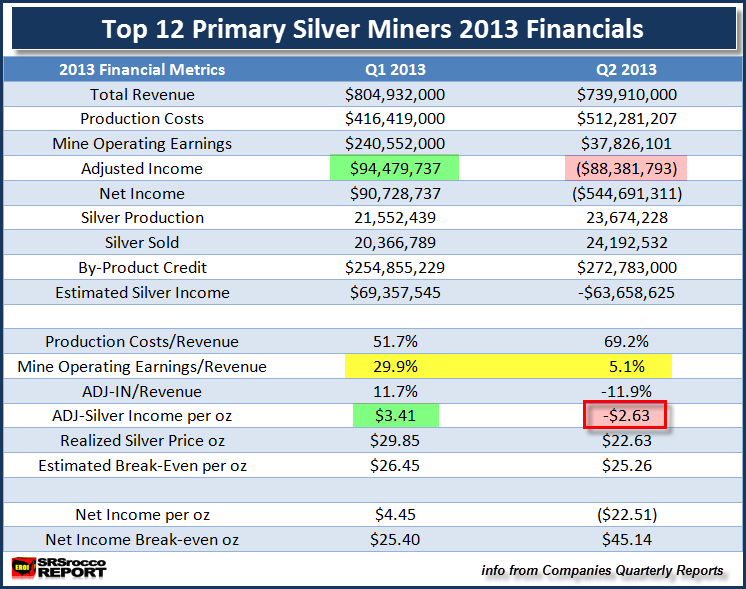
Starting at the top of the table, total Revenues from group declined from $804.9 million in Q1 down to $739.9 million in Q2 2013. This was only a $65 million decline or 8% less than the previous quarter, but the group sold a great deal more silver and still suffered a large loss.
You will notice that in Q1, there were 20.3 million oz in silver sales, however in the second quarter the top 12 miners sold nearly 4 million more ounces or a total of 24.1 million oz. Furthermore, the by-product credits increased from $254.8 million in Q1 to $272.8 million during Q2 2013.
Not only did the top 12 primary miners sell nearly 20% more silver and $18 million more in by-product metal revenue compared to the previous quarter, they recorded a $544.6 million net income loss instead of a $90.7 net income gain during Q1 2013.
Again, the majority of the half a billion dollar loss was due to impairment write-offs by the companies from much lower average silver prices reflected during the second quarter – Silver Standard took a $202 million impairment charge and Pan American wrote off $185 million.
NOTE: My top 12 primary silver miners do not include Fresnillo or Hochshild. While both of these companies are primary silver miners, they only state their financials every 6 months. It is true that Fresnillo recording profits for the year, however Hochschild reported a loss. Also, Fresnillo now receives more revenue from gold than silver.
ADJUSTED INCOME: The Tell-Tale Sign of Profitability
Regardless, the real tell-tale sign of the quarter to quarter profitability of a mining company is shown by its “Adjusted Income.” Highlighted in green, the primary silver miners as a group recorded $94.4 million in adjusted income during the first quarter of 2013. However, just three months later they stated an adjusted income loss of $88.3 million.
This turns out to be an amazing $183 million dollar net change from quarter to quarter ($94.4 + $88.3 = $182.7 million).
As a refresher, many companies provide adjusted income by taking out impairment charges, acquisitions/sales of properties, losses due to derivatives and etc. If a company does not provide an adjusted income, I manually calculate it myself. This adjusted income figure does not meet exact accounting standards… but it comes pretty close.
The reason why we have to go by adjusted income is due to the fact that net income becomes totally useless in obtaining a break-even cost analysis if it contains a great deal of gains or losses not attributed to the day-to-day operation of mining silver.
For example, if you look at the bottom of the chart, you will see that the miners as a group stated a net income loss of $22.51 per ounce of silver. Which means they would need $45.14 an ounce to break-even… according to the net income approach. Those huge impairment write-offs have significantly skewed the ability to find a more common sense break-even.
Before we get to the next chart, take a look at the yellow highlighted area. This is the mine operating earnings which account for production costs, royalties and depreciation, depletion & amortization… and that’s it. It does not include general & administrative, exploration, foreign exchange losses and etc.
In just one-quarter, the mine operating earnings of the group fell from 29.9% of total revenue down to 5.1%. That means the remaining 5.1% of the income had to pay the rest of the bills including taxes.
The Top 12 Primary Miners Q2 2013 Estimated Break Even
This next chart shows what happens to the primary mining industry when the price of silver is taken down by the Fed and Central Banks.
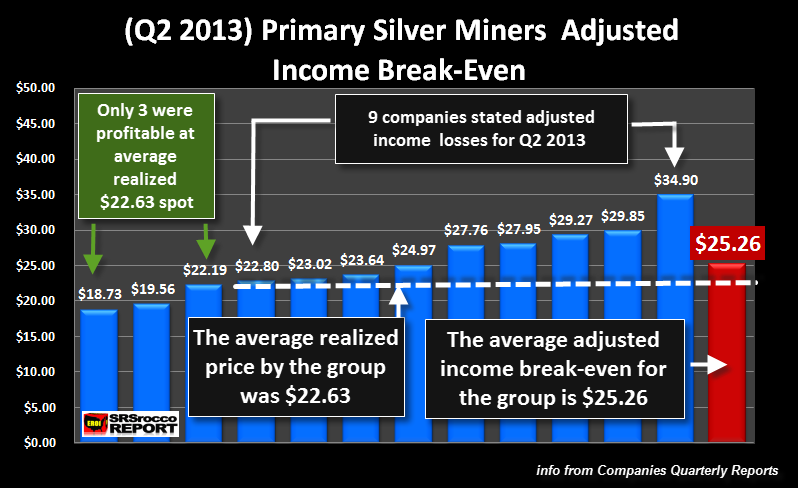
According to my calculations of the top 12 primary silver miners in my group, the average realized price received during Q2 2013 was $22.63. The white dotted line shows where this $22.63 level falls. As you can see, it runs below nine of the silver companies. Thus, nine of the silver miners had adjusted losses for the period.
The BLUE BARS represent the “Adjusted Break-Even” for each of the twelve silver miners. The large RED BAR shows the average adjusted break-even for the group. In order for the top 12 primary silver miners to break-even as a group, they had to receive $25.26 an ounce during the second quarter.
Because the average realized price of silver was only $22.63, the group lost $2.63 of silver income for every ounce of silver they sold in Q2 2013. Before we go any further, let me explain my method.
The adjusted income loss was $88.3 million. So, if we were to divide that figure by 24.1 million oz of silver sales, it would show a $3.66 loss per ounce and not the $2.63 that I calculated. The reason for the difference is that I believe part of the gain or loss of adjusted income is attributed to the by-product metal revenue.
If a mining company receives 60% of its revenue from silver and 40% from its by-product credits (revenue), then part of the adjusted gain or loss comes from either that copper, lead, zinc or gold that was sold. Again, my method is to find a more “Pure Silver Income.”
Heading back up to the table at the top of the article, you can see that the Estimated Break Even (pure silver) in Q1 2013 was $26.45 and in Q2 it had fallen to $25.26. Part of the reason why I believe this figure declined was due to cutting of costs as well as more revenue received from by-product metals.
Yes, I realize that the production costs increased substantially from $416 million Q1 to $512 million in Q2, but that was mainly due to Coeur & Hecla ramping up production compared to the previous quarter.
There is so much more to explain and discuss on these matters, but that will be available in the “Silver Miners Paid Report” that will be coming out soon.
Estimated Break-Even is Not a Sustainable Figure
I want to make sure that the reader-investor realizes that a break-even figure is not something a mining company shoots for. They are in the business to make profits. From those profits the company can acquire more properties, expand its projects, pay dividends and etc.
A mining company can not survive by breaking even for an extended period. It needs profits to sustain its business model of replacing reserves as well as dealing with rising costs in the future. I have read where individuals believe the mining companies can produce silver at much lower prices while hiding profits through supposed tax write-offs such as depletion, depreciation and amortization (D,D & A).
I am not going to get into details on D, D & A, but I will make a brief point by using Pan American Silver as an example:
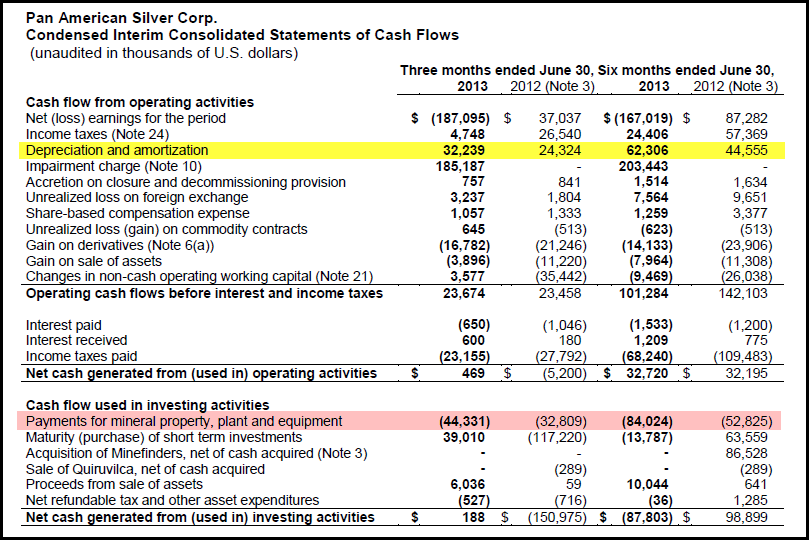
The yellow highlighted area shows the depreciation & amortization (D & A). If we just look at Q2 2013, you will see that Pan American recorded a $32.2 million for D & A. That $32.2 million figure was not an actual cash expense but an estimated operational expense that denotes the decline in value of the mine, plant & equipment.
If you go down to the red highlighted area, you will see that they made payments of $44.3 million for mineral property, plant and equipment. According to their segmented information on capital expenditures for Q2 2013, Pan American actually spent $46.8 million on their seven mines during the second quarter.
While that $32.2 million in depreciation & amortization is not an actual operational expense for the quarter, that $46.8 million in CAPEX sure is. Basically, Pan American spent more on CAPEX in Q2 than it recorded for its D & A. Here we can see that maintaining mines, plant and equipment is an expensive affair for the mining industry.
Even though my estimated break-even for the top 12 primary silver miners was an average of $25.26 an ounce, at least five in the group would lose money at that price. Moreover, these miners need to make profits to sustain their business in the future. I would imagine a price of at least $30 an ounce would be needed by the group and even higher for the marginal producers if they want to stay in business for the longer haul.
Lastly, as the primary silver miners are presently struggling with manipulated low prices, I believe market conditions will turn around, making this industry one of the most successful investments in the future.
More on that in upcoming articles.